Lesson 1.2: Process memory map
When you double-click an .exe file, the OS doesn’t run it straight from disk. It creates a process, gives it its own chunk of memory, loads the code in, and then lets it run. You need to know the layout of that memory, because that’s where your debugger will be all day. Without it you look at an address and can’t tell if it’s code, a variable, or junk.
Every process has its own address space
Two processes can both see the address 0x401000, and they are two completely different physical memory cells. Each process lives in its own isolated virtual address space, so process A can’t accidentally read the memory of process B.
The addresses you see in IDA or a debugger are virtual addresses, and the OS translates them to real physical addresses in RAM. As a reverse engineer you almost always work with virtual addresses, so each process sees its own continuous range of addresses.
In practice, to read or write another process’s memory (which every injection technique in Part 17 relies on), you have to ask the OS through APIs like ReadProcessMemory and WriteProcessMemory. You can’t reach over directly.
The memory map of a process
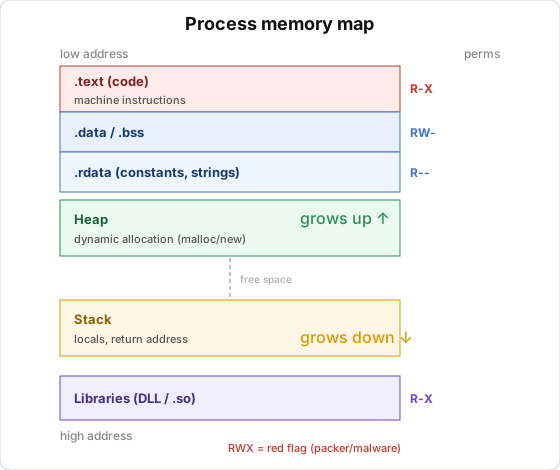
The address space is split into several regions. From low to high, roughly:
1
2
3
4
5
6
7
8
9
10
11
12
13
14
15
16
17
18
19
low address
  +-------------------------+
  |  Code (.text)           |  machine instructions, read + execute only
  +-------------------------+
  |  Initialized data       |  .data: globals with an initial value
  |  (.data)                |
  +-------------------------+
  |  Uninitialized data     |  .bss: globals = 0
  |  (.bss)                 |
  +-------------------------+
  |  Heap  --->             |  dynamic allocation (malloc/new), grows upward
  |                         |
  |         ...             |
  |                         |
  |              <--- Stack |  locals, function calls, grows downward
  +-------------------------+
  |  Libraries (DLL/.so)    |  kernel32, libc... get loaded here
  +-------------------------+
high address
In x64dbg, open the Memory Map tab and you see this map with real addresses, access rights (R/W/X), and which module owns which region. You’ll have this window open a lot.
The main sections
A PE or ELF file is split into sections, and when it’s loaded each section becomes a region. The .text section holds the machine instructions. Its permissions are usually read + execute, no write, so an R-X region is almost certainly code. (Self-modifying code needs write permission, and that’s suspicious, covered in Part 15.) The .data section holds globals with an initial value, read + write. The .bss section holds globals initialized to 0. It takes no space on disk, the loader just allocates an empty region. The .rdata / .rodata sections hold read-only data like constants and strings, and your “Wrong password” string usually lives there.
Stack
The stack is the region to understand best, because almost every function uses it. It’s last in, first out (LIFO), so push puts things on and pop takes them off. On x86/x64 the stack grows down, so a push makes the top pointer (rsp) decrease. It feels backwards, but just remember it. Every function call builds a block called a stack frame to hold the return address (pushed by call), the local variables, and sometimes parameters. When the function does ret, the frame is dropped and the stack shrinks back.
Since locals sit on the stack, in assembly you see them as [rbp-4], [rbp-8] (relative to the base pointer) or [rsp+8] (relative to the top of the stack). When IDA names things var_4, var_8, it’s naming these locals. Lesson 1.4 goes through the stack frame in detail.
The stack is also behind a whole class of security bugs (stack buffer overflow). Writing past a local variable can overwrite the return address, and controlling the return address means controlling execution flow. That belongs to exploit development, but it starts with how the stack works.
Heap
When a program needs memory whose size is only known at runtime (how many bytes a file has, how long a string the user types), it asks the heap through malloc, new, HeapAlloc. It differs from the stack in a few ways. The programmer (or the runtime) manages it, so what you ask for you have to give back (free, delete), and forgetting is a memory leak. Heap regions live a long time and aren’t cleaned up when the function returns. In RE, if a pointer points into the heap (usually its own address range in the Memory Map), it’s dynamically allocated data, for example a struct or an array.
ASLR
It used to be that a program always loaded at the same address, for example 0x400000. Now the OS uses ASLR (Address Space Layout Randomization), which places code and libraries are placed at different random addresses, so they’re harder for an attacker to guess.
This means the address you see in IDA (a static address, based on the default base) differs from the real address in the debugger at runtime. To match the two, use offsets relative to the module base. x64dbg has a “follow in disassembler” button and a rebase feature to help sync them. Don’t panic when the address in IDA is 0x401500 and in the debugger it’s 0x7FF6xx401500. The tail 401500 is the part to compare.
Access rights
Each memory region has permissions, R (read), W (write), X (execute). They tell you the intent. R-X is normal code and RW- is normal data. RWX is both writable and executable. It’s rare in clean software but common in malware and packers, because they write decrypted code there and then jump to it. If you see an RWX region in the Memory Map, pay attention.
Key takeaways
Every process has its own isolated virtual address space, and the addresses you see are virtual. The layout is code (.text), data (.data/.bss/.rdata), heap (grows up), stack (grows down), and libraries. The stack is LIFO, grows down, and holds locals and the return address, with locals showing up as [rbp-x]. The heap is allocated at runtime and you have to free it yourself.
ASLR changes addresses every run, so compare the offset part and not absolute addresses. An RWX region is suspicious, often seen in packers and malware.