Lesson 1.2: Stack Frames, call/ret, Saved RIP, and the System V AMD64 Calling Convention
This is the single most important foundational lesson in Part 1. If you truly understand how a stack frame is built, where saved RIP sits, and which registers carry function parameters, most later stack exploitation lessons become straightforward application of these ideas. Without this lesson, every exploit you write is copied blindly.
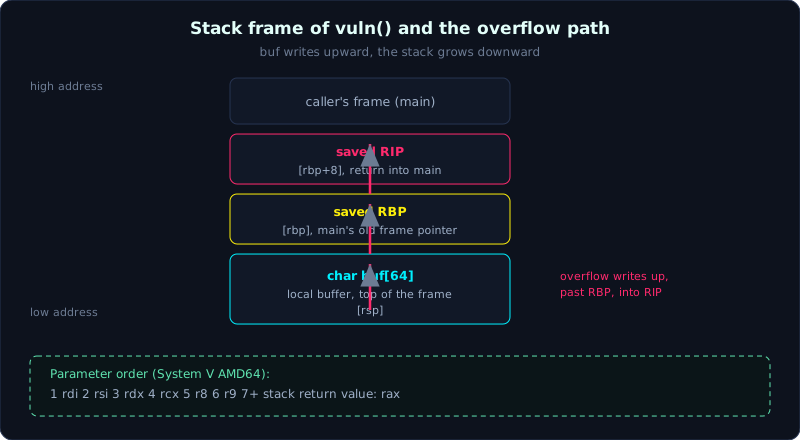 The frame layout of a vulnerable function. The buffer writes upward while the stack grows downward, so an overflow reaches saved RBP and then saved RIP.
Part: 1 · Time: about 60 minutes of reading plus lab · Difficulty: medium
Prerequisites: Lesson 1.1 (registers, call/ret/leave). Lesson 0.3 (the stack grows down).
Tools: gcc, gdb with pwndbg, objdump.
Goals
After this lesson you should be able to draw a complete stack frame (parameters, saved RIP, saved RBP, local variables), explain exactly what call/ret/leave do to rsp, rbp and rip, point out where saved RIP sits relative to a local buffer and why an overflow reaches it, know the System V AMD64 parameter register order (rdi, rsi, rdx, rcx, r8, r9), and know the 16 byte stack alignment rule and why it often crashes exploits.
1. Theory
What a stack frame is
Each time a function is called, it builds its own working area on the stack called a stack frame. A frame contains the return address (so the program knows where to go back after it finishes), the old rbp value (so the caller’s frame can be restored), and the function’s local variables. When the function returns, the frame is torn down and the stack goes back to what it was before the call.
Recall from Lesson 0.3 that the stack grows down, high addresses are at the top, low addresses are at the bottom, and rsp points to the top (the lowest address currently in use).
Building a frame step by step: what happens on a function call
Suppose main calls vuln(). Follow the stack as it changes.
Step 1, main executes call vuln. The call instruction pushes the address of the instruction right after it (the return address) onto the stack, then jumps into vuln. This return address later becomes saved RIP, the value pwn wants most.
Step 2, vuln runs its prologue (the function’s opening sequence):
push rbp          ; push the old rbp (main's) onto the stack -> saved RBP
mov  rbp, rsp     ; new rbp = current stack top, the anchor for the vuln frame
sub  rsp, 0x50    ; reserve room for locals (e.g. buf[64] + alignment)
After the prologue, the stack frame of vuln looks like this (high addresses at the top):
1
2
3
4
5
6
7
8
9
10
11
12
13
   HIGH address
   +---------------------------+
   |   ... frame of main ...   |
   +---------------------------+
   |   return address          |  <- saved RIP (pushed by `call vuln`)
   +---------------------------+  <- [rbp+8]
   |   saved RBP (main's rbp)|  <- pushed by `push rbp`
   +---------------------------+  <- rbp points here
   |   local variables         |
   |   ...                     |
   |   char buf[64]            |  <- buf is usually at [rbp-0x40] or similar
   +---------------------------+  <- rsp points here (top)
   LOW address
Look closely at this picture, it is the center of everything. Notice three things.
One, saved RIP sits at [rbp+8], which is at a HIGHER address than rbp, and much higher than buf.
Two, saved RBP sits right at [rbp], between buf and saved RIP.
Three, buf is at the LOW address (the bottom), but when you write into buf, the data runs from the low address UP toward higher addresses. This means that if you write too much into buf, the data crawls upward, overwrites saved RBP, and then overwrites saved RIP. This is exactly the mechanism of a stack buffer overflow: the opposite directions of “the stack grows down” and “the buffer writes up” are what let an overflow reach saved RIP.
Epilogue and ret: the decisive moment
When vuln finishes, it runs its epilogue (the function’s closing sequence):
leave             ; = mov rsp, rbp ; pop rbp
                  ;   mov rsp,rbp: rsp jumps back up to the frame base (dropping the locals)
                  ;   pop rbp     : restore the saved RBP into rbp, rsp += 8
ret               ; pop the value at the top of the stack (the saved RIP) into rip
After leave, rsp points exactly at the slot holding saved RIP. The ret instruction takes the value in that slot, loads it into rip, and jumps there. If saved RIP is still a valid address inside main, the program continues normally. But if you overflowed the buffer and replaced saved RIP with an address of your own, ret obediently jumps there. Stages 3 and 4 of the life cycle from Lesson 0.1 both happen in this one ret instruction.
Said again plainly, because this is the core idea:
call f: push (the address after call) then jmp f. The return address goes onto the stack.ret: pop into rip. It trusts the top of the stack completely.leave: mov rsp, rbp; pop rbp. Tears down the frame.
The System V AMD64 calling convention: where parameters go
The calling convention is the set of rules for how parameters are passed when a function is called, where the return value goes, and who cleans up. Linux x86-64 follows the System V AMD64 ABI. The rule for integer and pointer parameters, which you MUST know by heart:
1
2
  Parameter #:   1     2     3     4     5     6     >6
  Passed in:     rdi   rsi   rdx   rcx   r8    r9    overflow to STACK
The first six parameters go through six registers in exactly this order: rdi, rsi, rdx, rcx, r8, r9. From the seventh parameter onward they spill onto the stack. The return value is in rax. (Float and double parameters go through xmm0 through xmm7, but basic pwn rarely touches these.)
A way to remember the order: “Diane’s silk dress costs $89” (rDi, rSi, rDx, rCx, r8, r9). Or just repeat “di si dx cx r8 r9” until it sticks. This order matters because when you want to call system("/bin/sh") through ROP, you must load the address of the string "/bin/sh" into exactly rdi (the first parameter). The whole “pop rdi gadget” technique in Parts 3 and 6 exists only to do this.
Compare this with the demo in Lesson 1.1: the function add(int a, int b) receives a through edi (the low part of rdi) and b through esi. That matches the rule.
Caller-saved and callee-saved, briefly
The ABI also splits registers into two groups: callee-saved (rbx, rbp, r12 through r15, which a called function must preserve, saving and restoring them if it uses them) and caller-saved (rax, rcx, rdx, rsi, rdi, r8 through r11, which the caller must protect itself, since the called function is free to overwrite them). Beginners do not need to memorize this fully, just understand why a prologue sometimes has a push rbx (it is saving a callee-saved register).
The 16 byte stack alignment rule: a classic trap
The System V ABI requires that at the moment a call instruction executes, rsp must be divisible by 16 (16 byte aligned). The technical reason is that some SSE instructions (such as movaps) inside libc functions require 16 byte aligned data, and running on a misaligned stack fails immediately.
Why this haunts pwn: when you build a ROP chain or a ret2libc call and jump into system, if rsp is off by 16 bytes at that moment, system (or a function it calls) will crash right inside movaps, even though every address you computed was correct. The symptom is an exploit that jumps exactly into system but dies with a strange error. The standard fix is to insert one extra single ret gadget (an instruction that only does ret) into the chain, which pushes rsp forward by 8 bytes and restores 16 byte alignment. You will meet this situation again in Part 6. For now just remember that it exists.
2. Demo
Watching a frame form in gdb
Reuse a program like crackme.c from Lesson 0.1, but written more explicitly:
1
2
3
4
5
6
7
8
9
10
11
12
13
14
15
#include <stdio.h>
#include <string.h>

void vuln(void) {
    char buf[64];
    printf("buf at        : %p\n", (void*)buf);
    printf("&saved_rbp ~   : %p\n", (void*)(buf + 64));       // approximate
    gets(buf);
    puts(buf);
}

int main(void) {
    vuln();
    return 0;
}
1
gcc -fno-stack-protector -no-pie -g -o frame frame.c
Open gdb, stop at the start of vuln, and look at the frame:
1
2
3
4
5
6
7
8
9
gdb -q ./frame
pwndbg> break vuln
pwndbg> run
pwndbg> next           # run past the prologue so rbp settles
pwndbg> next
pwndbg> p $rbp         # current rbp value
pwndbg> p $rsp         # address of the stack top
pwndbg> x/gx $rbp      # show saved RBP (value at [rbp])
pwndbg> x/gx $rbp+8    # show saved RIP (value at [rbp+8]) -> must be an address inside main
The value at $rbp+8 is saved RIP. Compare it with disassemble main and you will see it points right after the call vuln instruction. That is live proof of everything just explained.
Measuring the distance from buf to saved RIP
This is a skill you will use in every overflow lesson. The manual way is to take the distance as (address of saved RIP) minus (address of buf).
1
pwndbg> p/d ($rbp+8) - (long)buf    # if buf is a variable, or take the address from the print above
This usually gives a number like 72: 64 bytes of buf, plus 8 bytes of saved RBP, reaches saved RIP. This means a payload of "A"*72 + <8 byte address> places your address exactly at saved RIP. (Lesson 3.2 teaches how to automate this measurement using pwntools’ cyclic pattern, which is much faster.)
Confirming the System V convention directly
Write a function with six parameters and see which registers they land in:
1
2
3
4
5
#include <stdio.h>
void six(long a, long b, long c, long d, long e, long f) {
    printf("%ld %ld %ld %ld %ld %ld\n", a, b, c, d, e, f);
}
int main(void) { six(1, 2, 3, 4, 5, 6); return 0; }
1
2
gcc -O0 -no-pie -o six six.c
objdump -d -M intel six | sed -n '/<main>:/,/call.*six/p'
Right before call six you will see a series of load instructions: mov edi, 1, mov esi, 2, mov edx, 3, mov ecx, 4, mov r8d, 5, mov r9d, 6. Exactly the order rdi, rsi, rdx, rcx, r8, r9. Seeing this once with your own eyes makes it stick.
Watching call and ret manipulate the stack
1
2
3
4
5
6
7
8
9
10
gdb -q ./six
pwndbg> break main
pwndbg> run
pwndbg> p $rsp            # note down the rsp value
# set a breakpoint right at the call six instruction (get the address from disassemble main)
pwndbg> ni                # step until just before the call
# At the call instruction, use "si" (step into) to enter six:
pwndbg> si
pwndbg> p $rsp             # rsp dropped by 8 because `call` just pushed the return address
pwndbg> x/gx $rsp          # value at the top = return address, pointing into main
You see rsp decrease by exactly 8 bytes after call, and the top of the stack holds the return address. That is call doing its job.
3. Lab
- Task: using the
frame.cprogram above, manually determine the distance frombufto saved RIP, then verify it by sending a payload of the right length so that saved RIP is overwritten with bytes of your choosing. - Goal: confidently point out where saved RIP is and compute the offset without anyone guiding you.
- Hints, in steps:
- Hint 1: in gdb, take the address of
buf(already printed) and the value of$rbp+8. Their difference is the offset. Write the number down. - Hint 2: send
python3 -c 'import sys; sys.stdout.buffer.write(b"A"*OFFSET + b"BBBBBBBB")' | ./framewith OFFSET being the number you just computed. Run it inside gdb, and when it crashes, checkinfo registers rip. You should see rip containing0x4242424242424242(which is “BBBBBBBB”). If you see that, you have controlled saved RIP. - Hint 3: if rip comes out full of
0x41(the letter A), your offset is too short and “BBBB” has not reached saved RIP yet. If the program does not crash and keeps running, the offset is too long. Adjust it.
- Hint 1: in gdb, take the address of
- Self check: can you answer “what is the offset and why” (hint: buffer size plus padding up to rbp plus 8 bytes of saved RBP)? Can you redraw the stack frame and point to the exact saved RIP slot?
4. Key takeaways
- Stack frame from high to low: [overflowing parameters] / saved RIP ([rbp+8]) / saved RBP ([rbp]) / local variables / buf (the top).
- A buffer writes from low to high addresses while the stack grows down, so an overflow crawls up into saved RBP and then saved RIP.
- call = push return address + jmp; ret = pop into rip; leave = mov rsp,rbp + pop rbp.
- Parameters go rdi, rsi, rdx, rcx, r8, r9, then spill to the stack; the return value is in rax.
- The offset to saved RIP is usually buffer size plus 8 (saved RBP), always verify with gdb.
- Before a
call, rsp must be divisible by 16. If it is off, insert one extraretgadget to realign it.
5. Common pitfalls
- Getting the overflow direction backward, thinking a write into buf goes toward lower addresses. It does not. buf writes UP toward higher addresses, where saved RBP and then saved RIP sit. Draw the picture whenever you get confused.
- Forgetting the 8 bytes of saved RBP when computing the offset, coming up exactly 8 short. The offset to saved RIP equals (distance from buf to rbp) plus 8, not just the distance to rbp.
- Assuming the offset equals exactly the declared array size. The compiler often inserts alignment padding, so
buf[64]might be 72 or 88 bytes from saved RIP. Always measure, never guess. - Loading the address of
/bin/shinto the wrong register (rsi instead of rdi) when building a call to system. The first parameter is ALWAYS rdi. - Ignoring the 16 byte alignment rule: a ret2libc jumps exactly into system and still crashes inside movaps. Add one ret gadget to fix it. This mistake costs beginners hours.
- Debugging in gdb and getting an offset different from running outside gdb, because gdb adds environment variables that shift the stack. Compute the offset as a relative distance (buf to saved RIP), which stays stable regardless of the environment.
6. Further reading
- “System V Application Binary Interface, AMD64 Architecture Processor Supplement”: the original document defining the calling convention. Read the “Parameter Passing” section and the register classification table.
- Eli Bendersky, “Stack frame layout on x86-64”: a blog post with very clear frame diagrams, good for reinforcement.
- pwndbg: the
stackandtelescope $rspcommands print the stack with annotations. Try watching saved RIP get highlighted. - ROP Emporium, the “ret2win” challenge: applies the offset to saved RIP you learned here directly, and you will meet it again in Part 3.