Lesson 1.1: x86-64 Assembly Review for Pwn, Registers, Instructions, Intel vs AT&T
You do not need to master assembly to do pwn. You need enough to read what the debugger prints and understand what is happening to registers and the stack. This lesson covers exactly that: which registers matter, which instructions show up often, and how to read both the AT&T and Intel syntaxes.
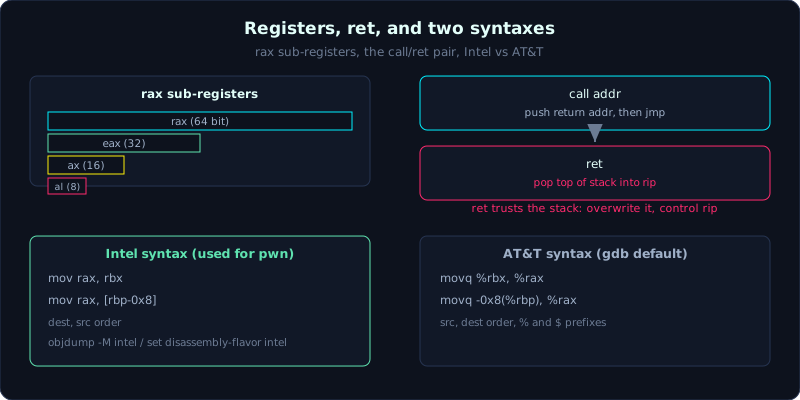 The rax sub-registers, the call/ret pair, and the same instruction in Intel versus AT&T syntax.
Part: 1 · Time: about 55 minutes of reading plus lab · Difficulty: medium
Prerequisites: Lesson 0.3. Basic C and hexadecimal.
Tools: gcc, objdump, gdb with pwndbg.
Goals
After this lesson you should be able to name the 16 general-purpose registers plus rsp/rbp/rip/rflags and their roles, understand the size naming convention (rax/eax/ax/al) and the zero-extend trap of eax, read common instructions (mov, lea, push/pop, call/ret/leave, cmp/jmp), decode memory operands of the form [base + index*scale + disp] and RIP-relative addressing, and read both AT&T and Intel syntax and force a debugger to use Intel.
1. Theory
Setting the stage
When exploiting, you live in gdb, looking at a frame full of registers and a column of assembly instructions. If you cannot read that frame, you are blind. So the goal here is not to write elegant assembly, but to look at a line like mov rax, qword [rbp-0x8] and know immediately what it does, and to look at call rdx and think “it calls through a pointer, do I control rdx”.
Registers: ultra fast storage inside the CPU
A register is a storage cell inside the CPU itself, accessed extremely fast, where the actual computation happens. x86-64 has 16 general-purpose 64-bit registers:
1
  rax rbx rcx rdx        rsi rdi rbp rsp        r8 r9 r10 r11 r12 r13 r14 r15
Each 64-bit register can be accessed at smaller sizes under different names. Take rax as an example:
1
2
3
4
5
6
7
  63                              31              15      7     0
  +-------------------------------+---------------+-------+-----+
  |              rax (64 bit)                             |
  |                               |      eax (32 bit)           |
  |                               |               | ax (16) |
  |                               |               |  ah | al |   al = low 8 bits
  +-------------------------------+---------------+-------+-----+
The rule: rax is 64-bit, eax is the lower 32-bit, ax is the lower 16-bit, al is the lower 8-bit (ah is the next 8-bit, bits 8 to 15). The registers r8 through r15 have the same kind of variants: r8d (32), r8w (16), r8b (8).
There is a trap worth remembering because it often breaks calculations in pwn: writing to a 32-bit register automatically zeroes (zero-extends) the upper 32 bits of the 64-bit register. This means mov eax, 1 makes the whole rax become 0x0000000000000001. But mov al, 1 does NOT touch the upper bits, it only changes the lowest 8 bits. This small detail matters when you compute a return value or build a register value through a gadget.
Registers with a special role
Most of the 16 registers are general purpose, but a few have a fixed role that pwn requires you to know by heart.
rsp (Stack Pointer) always points to the current top of the stack. push decreases rsp, pop increases it. Controlling rsp is one of the big goals in pwn, which is the basis of a stack pivot discussed later.
rbp (Base Pointer / Frame Pointer) usually points to the bottom of the current function’s stack frame and is used as a reference point for accessing local variables through [rbp-0x..] and parameters. Lesson 1.2 covers the rbp/rsp pair in detail.
rip (Instruction Pointer) points to the next instruction the CPU will execute. You CANNOT write directly to rip with an instruction like mov rip, .... The whole craft of pwn is about controlling rip indirectly: through ret (which pops a value from the stack into rip), or through call/jmp to a pointer you control. Remember that rip is the target, but we reach it through another route.
rflags is the flags register, holding the result of the most recent comparison for conditional jump instructions to use. A few common flags: ZF (Zero Flag, set when the result is zero), SF (Sign Flag, set when the result is negative), CF (Carry Flag). You rarely touch these directly, but you need to know they drive je/jne/jg/jl.
Common instructions, grouped
You do not need to learn the whole x86-64 instruction set, which is enormous. This is the subset you will meet 95% of the time reading a pwn binary. Using Intel syntax (dest, src):
Moving data:
mov dest, srccopies src into dest.mov rax, rbx(copy a register),mov rax, [rbx](read from the memory at address rbx),mov [rbx], rax(write to memory).lea dest, [expr](Load Effective Address) computes the address of[expr]and puts it in dest, WITHOUT accessing memory.lea rax, [rbp-0x40]loads the address of a buffer into rax. This is very common when code takes the address of a local variable, which is exactly the buffer pointer you are about to overflow.movzx/movsx: copy a small value into a larger register, zero-extending (filling with zero) or sign-extending (filling according to the sign).
Stack operations:
push srcpushes src onto the stack: rsp decreases by 8, then src is written to[rsp].pop desttakes the value from the top of the stack: reads[rsp]into dest, then rsp increases by 8.
Arithmetic and logic:
add,sub,inc,dec: add, subtract, increment by 1, decrement by 1.xor rax, rax: a short, common way to zero out rax (XOR of a value with itself is zero). Seeingxor reg, regmeans “set reg to 0”.and,or,shl,shr: bitwise logic and bit shifts.
Comparison and jumps:
cmp a, bcomputesa - bbut only to set flags, without storing the result.test a, bcomputesa & bto set flags.test rax, raxis a common way to check whether rax is zero.jmp addrjumps unconditionally.je/jzjumps if equal (ZF=1),jne/jnzjumps if not equal,jg/jljumps if greater/less (signed),ja/jb(unsigned).
Calling and returning, the most important group for pwn:
call addr: this actually does two things, it pushes the address of the instruction right aftercall(this is the return address) onto the stack, then jumps to addr. Remember that call PUSHES a return address onto the stack.ret: pops the value at the top of the stack into rip and jumps there. In other words,rettrusts completely whatever sits on top of the stack. If you have overwritten that value,retjumps right where you put it. This is the heart of every stack overflow.leave: shorthand formov rsp, rbpfollowed bypop rbp, used to tear down the stack frame before ret. Seeingleave; retat the end of a function is the classic epilogue pair.
Memory operands: address syntax
When an instruction accesses memory, the address is written inside square brackets, in the general form:
1
  [ base + index*scale + displacement ]
- base: the base register, for example rbp, rax.
- index*scale: an index register multiplied by 1, 2, 4 or 8 (used for array access).
- displacement: an added constant.
A few examples to get used to reading:
[rbp-0x8]: the address rbp minus 8, usually a local variable.[rax+rcx*4]: an element of an int array (4 bytes each) at index rcx, with base rax.[rip+0x2e55]: RIP-relative addressing (an address computed relative to the instruction pointer). Very common in PIE binaries, because the code does not know where it was loaded and so references data relative to rip. When you seelea rdi, [rip+0x...], the code is usually taking the address of a constant string.
AT&T versus Intel: the same instruction, two notations
This is what confuses beginners most, because the same code looks entirely different depending on the tool. gdb by default and many GNU tools use AT&T. IDA, most pwn write-ups, and most CTF players use Intel. The main differences:
- Operand order is REVERSED. Intel:
dest, src. AT&T:src, dest. - AT&T attaches prefixes:
%before a register,$before an immediate value. - AT&T adds a size suffix to the instruction:
b(byte),w(word, 16 bits),l(long, 32 bits),q(quad, 64 bits). Somovbecomesmovq,movl. - Memory syntax differs: Intel
[rbp-0x8], AT&T-0x8(%rbp).
A comparison table for a few instructions:
1
2
3
4
5
6
  Meaning                     Intel                     AT&T
  rax = rbx                   mov rax, rbx              movq %rbx, %rax
  rax = 1                     mov rax, 1                movq $1, %rax
  rax = [rbp-8]               mov rax, [rbp-0x8]        movq -0x8(%rbp), %rax
  compare edi with 10         cmp edi, 10               cmpl $10, %edi
  load address of buf         lea rax, [rbp-0x40]       leaq -0x40(%rbp), %rax
My advice is to pick Intel and force every tool to use it, to stay consistent with pwn documentation. To set it:
1
2
3
4
# In gdb (type once per session, or write it to ~/.gdbinit):
set disassembly-flavor intel
# With objdump:
objdump -d -M intel ./binary
pwndbg actually already turns Intel on by default, so if you followed Lesson 0.2 you do not need to worry. Still, knowing both syntaxes is useful, because you will sometimes read a write-up or another tool’s output written in AT&T.
2. Demo
A small function to dissect
Save it as asm_demo.c:
1
2
3
4
5
6
7
8
9
10
11
12
13
14
15
16
17
18
19
#include <stdio.h>

int add(int a, int b) {
    int c = a + b;
    return c;
}

int classify(int x) {
    if (x > 100)
        return 1;
    return 0;
}

int main(void) {
    int s = add(3, 4);
    int t = classify(s);
    printf("%d %d\n", s, t);
    return 0;
}
Compile without optimization (-O0) so the assembly follows the source closely and is easy to read:
1
2
gcc -O0 -no-pie -o asm_demo asm_demo.c
objdump -d -M intel asm_demo | sed -n '/<add>:/,/ret/p'
The output of the add function looks roughly like this (annotated):
<add>:
  push   rbp                  ; prologue: save the old rbp
  mov    rbp, rsp             ; rbp = base of the new frame
  mov    [rbp-0x14], edi      ; store parameter a (edi) into a local variable
  mov    [rbp-0x18], esi      ; store parameter b (esi) into a local variable
  mov    edx, [rbp-0x14]      ; edx = a
  mov    eax, [rbp-0x18]      ; eax = b
  add    eax, edx             ; eax = a + b
  mov    [rbp-0x4], eax       ; c = a + b
  mov    eax, [rbp-0x4]       ; the return value lives in eax
  pop    rbp                  ; epilogue: restore rbp
  ret                         ; return to main
A few points to notice: the first parameter a arrives through edi, the second b through esi (this is the System V calling convention, explained fully in Lesson 1.2, for now remember rdi/rsi are the first two parameters). The return value is placed in eax. The push rbp; mov rbp, rsp at the start of the function is the prologue, and pop rbp; ret at the end is the epilogue.
Look at classify next to see cmp and jmp:
<classify>:
  push   rbp
  mov    rbp, rsp
  mov    [rbp-0x4], edi
  cmp    dword [rbp-0x4], 0x64   ; compare x with 100 (0x64)
  jle    <classify+0x..>         ; if x <= 100 jump to the return 0 branch
  mov    eax, 1                  ; branch x > 100: eax = 1
  jmp    <classify+0x..>
  ...
  mov    eax, 0                  ; remaining branch: eax = 0
  pop    rbp
  ret
cmp ..., 0x64 sets flags based on x - 100, then jle (jump if less or equal) decides whether to jump. Being able to read a cmp/jxx pair means being able to read every if statement inside a binary.
Watching it in gdb
1
2
3
4
5
6
7
8
gdb -q ./asm_demo
pwndbg> set disassembly-flavor intel     # pwndbg already enables it, typed here to be sure
pwndbg> break add
pwndbg> run
pwndbg> disassemble                        # show the assembly of function add
pwndbg> info registers rdi rsi rax rsp rip # show the register values
pwndbg> ni                                 # next instruction, run one instruction at a time
pwndbg> info registers rax                 # see how rax changed after the add
Stepping with ni one instruction at a time while watching rax and rsp change is the fastest way to learn assembly. You see exactly what each instruction does to registers and the stack.
Seeing AT&T versus Intel side by side
Run these two commands to compare the same add function:
1
2
objdump -d asm_demo        | sed -n '/<add>:/,/ret/p'   # AT&T (default)
objdump -d -M intel asm_demo | sed -n '/<add>:/,/ret/p'  # Intel
In the AT&T version you will see mov %edi,-0x14(%rbp) (reversed operands, with %, with suffixes). In the Intel version you will see mov [rbp-0x14], edi. Same instruction, different appearance. Looking at both side by side once is enough to remember it.
3. Lab
- Task: write a few C functions and explain line by line the assembly they produce.
- Goal: look at a disassembly without feeling overwhelmed, and be able to point out the prologue, the epilogue, where parameters are passed, and where comparisons happen.
- Hints, in steps:
- Hint 1: write a function with a
forloop summing from 1 to n. Compile with-O0, run objdump, find which[rbp-?]holds the counter, which instruction increments it, and whichcmp/jxxchecks the loop condition. - Hint 2: write a function that calls another function (nested). Watch each
callpush a return address, and try counting how much the stack changes when entering the inner function. - Hint 3: try recompiling the same file with
-O2and compare. The optimized assembly is much shorter, the standard prologue/epilogue disappears, and parameters sometimes stay in registers the whole time. This is why reverse engineering a real binary (usually built optimized) is harder than reading an-O0build.
- Hint 1: write a function with a
- Self check: can you explain exactly what
leaveandretdo to rsp, rbp and rip? (hint: leave = mov rsp,rbp; pop rbp. ret = pop rip.) Can you answer which register the first function parameter goes into? (hint: rdi, which leads directly into Lesson 1.2)
4. Key takeaways
- There are 16 general-purpose registers. rsp is the stack top, rbp is the frame pointer, rip is the next instruction and cannot be written directly.
- rax/eax/ax/al are the same register at different sizes. Writing eax zeroes the upper 32 bits.
- call pushes a return address then jumps. ret pops into rip. leave is mov rsp,rbp plus pop rbp.
rettrusts whatever is on top of the stack, so overwriting that spot gives control of the flow.[base + index*scale + disp]is the memory operand form.[rip+..]is RIP-relative, a sign of PIE.- Intel order is dest, src (used in pwn). AT&T order is src, dest, with % and $ prefixes. Force Intel with
-M intelorset disassembly-flavor intel.
5. Common pitfalls
- Misreading operand order because you did not notice whether you are looking at AT&T or Intel. Always identify the syntax first, then interpret the meaning. Seeing
%and$means AT&T. - Forgetting the zero-extend trap: thinking
mov eax, 0only changes the lower 32 bits, when it actually clears all 64 bits of rax. Converselymov al, xdoes not touch the upper bits. - Confusing
leawithmov.lea rax, [rbx]loads the address (the value of rbx), whilemov rax, [rbx]loads the content at the address rbx. Mixing these up leads to misreading the whole block of code. - Thinking you can write directly to rip. There is no
mov rip, ...instruction. Everything has to go through ret, call or jmp indirectly. - Starting to learn assembly from an
-O2binary and getting discouraged. Always practice on-O0first, and only look at the optimized version once you understand the basics. - Ignoring rflags and not understanding why
jlejumps sometimes and not other times. Remember thatcmp/testset the flags, and thejxxinstruction reads them.
6. Further reading
- “x86-64 Assembly Language Cheat Sheet”: print it and keep it nearby to look up instructions and registers quickly.
- Intel Software Developer Manual, Volume 2 (instruction set): use it to look up the exact behavior of an instruction when needed, not to read cover to cover.
- Godbolt Compiler Explorer (godbolt.org): paste C code, pick gcc x86-64, and see the generated assembly immediately, with C and asm side by side. The best tool available for learning assembly.
- “Assembly for pwn” on pwn.college (the Assembly Crash Course module): interactive exercises that match this lesson’s “just enough for pwn” goal closely.