Lesson 2.2: gdb and pwndbg, Looking Inside a Running Program
This lesson turns gdb from an intimidating tool into something you open by reflex whenever an exploit does not work. By the end you can set a breakpoint, inspect registers and the stack, find the overflow offset with a cyclic pattern, and read vmmap and the GOT/PLT, which is enough to debug every stack challenge in this series.
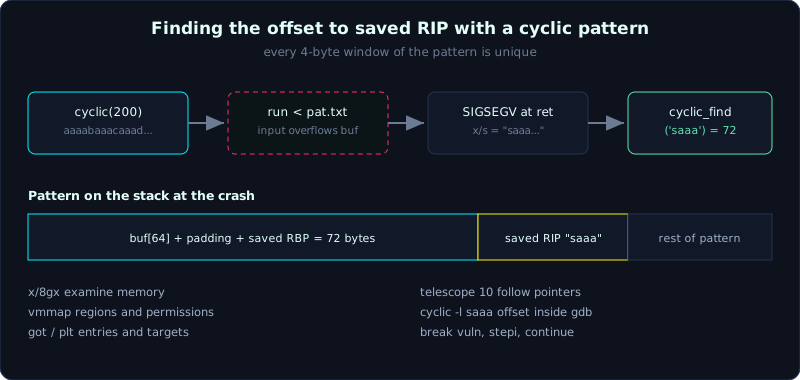 A cyclic pattern makes every 4-byte window unique, so the 4 bytes at the crash tell you the exact offset.
Prerequisites: Lesson 1.1 (x86-64 assembly, just enough), Lesson 1.2 (stack frame, saved RIP), Lesson 2.1 (pwntools, since cyclic is shared between the two).
Tools: gdb with one plugin, pwndbg (preferred) or GEF. Environment: Ubuntu 22.04, glibc 2.35.
Goals
After this lesson you can install and explain why you should use pwndbg/GEF instead of plain gdb. You can set a breakpoint by function name or by address, and run a program with input from a file. You can view registers, disassemble, and examine memory with x. You can find the offset to saved RIP with a cyclic pattern instead of guessing, and you can read vmmap, telescope, and look up GOT/PLT addresses.
1. Theory
Why you need a plugin
Plain gdb prints very little. To see the stack you must type x/20gx $rsp yourself, and to see which register points where you have to trace it by hand. When exploiting, you need to see at a glance the current registers, the stack contents, the next instruction, and which memory regions are writable. pwndbg and GEF are two plugins built for exactly this: every time the program stops, they print a full context panel with registers, disassembly, stack, and backtrace.
The two plugins are roughly equivalent in purpose. This series uses pwndbg in its examples, but the underlying gdb commands (break, run, x, info) are identical in both, so you can follow along with GEF too.
Install pwndbg (once):
1
2
git clone https://github.com/pwndbg/pwndbg
cd pwndbg && ./setup.sh
It automatically adds a line source .../pwndbg/gdbinit.py to ~/.gdbinit. Opening gdb ./vuln afterwards shows the prompt change to pwndbg>.
The model: the program stops, you observe, then you let it continue
gdb works in a rhythm: set a breakpoint, run to it, the program freezes, you inspect the state, then you step one instruction (stepi) or run to the next breakpoint (continue). When exploiting a stack bug, you often stop right before the ret instruction, to see exactly which address is about to be popped into RIP.
Feeding input to the program inside gdb
There are three ways to give input to a program while debugging:
run < payload.bin # load from a file, the simplest way to repeat a run
Or attach to a running pwntools process (debugging the real exploit script). In the script, use gdb.debug or gdb.attach:
1
2
3
4
io = gdb.debug('./vuln', '''
    break vuln
    continue
''')
The run < file approach is the easiest for newcomers: build the payload with pwntools, write it to a file, then load it.
2. Demo
Using the callme binary (you will meet it again in Lesson 3.3): it has a vuln function that reads 256 bytes into buf[64], and a win function taking one argument. No PIE keeps addresses fixed, which is easier to follow.
1
2
gcc -fno-stack-protector -no-pie -O0 -o callme callme.c
gdb -q ./callme
Breakpoint and run
pwndbg> break vuln           # stop at the start of vuln
Breakpoint 1 at 0x40121e
pwndbg> run < /dev/null      # run with empty input
Once stopped, pwndbg prints the context panel. The most important part right now is the disassembly of vuln:
pwndbg> disassemble vuln
Dump of assembler code for function vuln:
   0x0000000000401216 <+0>:     endbr64
   0x000000000040121a <+4>:     push   %rbp
   0x000000000040121b <+5>:     mov    %rsp,%rbp
=> 0x000000000040121e <+8>:     sub    $0x40,%rsp          # reserves 0x40 = 64 bytes for buf
   0x0000000000401222 <+12>:    lea    0xe10(%rip),%rax
   0x0000000000401229 <+19>:    mov    %rax,%rdi
   0x000000000040122c <+22>:    call   0x401080 <puts@plt>
The line sub $0x40,%rsp tells you the frame reserves 64 bytes for local variables, matching buf[64] in the source. The => arrow marks the instruction about to run.
Viewing registers and memory
The x (examine) command is the all-purpose tool. Syntax x/NFU addr: N is a count, F is a format (x hex, d decimal, i instruction, s string), U is a unit size (b byte, w 4 bytes, g 8 bytes).
pwndbg> x/8gx $rsp           # 8 values, 8 bytes each, hex, starting at RSP
pwndbg> x/s 0x402039         # read a string at that address
pwndbg> x/3i $rip            # 3 instructions from RIP
pwndbg> info registers rsp rip rdi
rsp            0x7fffffffda38   0x7fffffffda38
rip            0x40121e         0x40121e <vuln+8>
rdi            0x7fffffffdb48   ...
pwndbg also has telescope, which prints a memory region and, for each line, checks whether that value points somewhere else (pointer chaining). Looking at the stack this way tells you at a glance which pointer leads into libc and which stays on the stack:
pwndbg> telescope $rsp 10
Finding the offset with a cyclic pattern, not guessing
This technique must become second nature. Instead of sending AAAA... and guessing how many bytes are needed, you send a De Bruijn pattern: a string where every 4-byte window is unique. When the program crashes, you read the 4 bytes that overflowed into saved RIP and look up the exact position.
Build a pattern with pwntools and write it to a file:
1
2
3
from pwn import *
with open('pat.txt', 'wb') as f:
    f.write(cyclic(200))        # the string aaaabaaacaaad...
Load it into gdb and let it crash:
pwndbg> run < pat.txt
The program gets SIGSEGV. Since vuln has no canary, the ret instruction tries to pop the overflowed value into RIP. Look at the 4 bytes at the top of the stack at the crash:
pwndbg> x/s $rsp
0x7fffffffda38: "saaataaauaaavaaa..."
The first 4 bytes are saaa. Look it up with pwntools:
1
2
3
>>> from pwn import *
>>> cyclic_find(b'saaa')
72
The offset to saved RIP is 72. pwndbg also has two built-in commands for this if you prefer not to leave gdb:
pwndbg> cyclic 200              # print the pattern (or cyclic -o saaa to look it up)
pwndbg> cyclic -l saaa
72
That number 72 is exactly what you plug into b'A'*72 in the Lesson 3.2 exploit. This is why cyclic is a core skill: every overflow challenge starts by finding this offset.
vmmap: the process memory map
vmmap lists every memory region and its permissions. One look tells you where the binary is loaded, where the stack is, where libc is, and which region is executable:
pwndbg> vmmap
    0x400000  0x401000 r--p   ...  /path/callme
    0x401000  0x402000 r-xp   ...  /path/callme     <- code, executable
    0x402000  0x403000 r--p   ...  /path/callme
 0x7ffff7d...  r-xp   ...  libc.so.6                <- libc base, for computing offsets
 0x7ffffffde000  0x7ffffffff000 rw-p  [stack]       <- stack
The permission column (r-xp, rw-p) tells you which regions are executable (x). When NX is on, [stack] only has rw-, so shellcode placed on the stack will not run. vmmap is where you confirm that directly.
GOT and PLT in gdb
When you need to overwrite the GOT or leak libc, you need the addresses of specific entries:
pwndbg> got                    # print the GOT table: function name -> current address
pwndbg> plt                    # print the PLT entries
pwndbg> x/gx 0x404018          # read one specific GOT entry
got shows where the GOT currently points for each library function (puts, system, and so on). Before a function is first called, the GOT points back into the PLT (lazy binding). After the first call it points straight into libc. Reading that value is leaking libc.
3. Lab
- Task: compile the binary below and use gdb to find the offset to saved RIP yourself. No guessing, you must get the number from cyclic.
1
2
3
4
5
6
// crackme_offset.c
#include <stdio.h>
#include <unistd.h>
void secret(void){ puts("you can't call me here... or can you?"); }
void vuln(void){ char buf[88]; read(0, buf, 300); }
int main(void){ setvbuf(stdout,0,_IONBF,0); vuln(); return 0; }
1
gcc -fno-stack-protector -no-pie -O0 -o crackme_offset crackme_offset.c
- Goal: answer two questions. (1) What is the offset to saved RIP? (2) What is the address of the
secretfunction?
Reference workflow:
1
2
3
# build the pattern
from pwn import *
open('pat.txt','wb').write(cyclic(300))
gdb -q ./crackme_offset
pwndbg> run < pat.txt
pwndbg> cyclic -l $rsp          # pwndbg reads the 4 bytes at rsp and returns the offset directly
pwndbg> info address secret     # address of function secret
Hints, in steps:
- Hint 1:
buf[88]does not mean the offset to saved RIP is exactly 88. The compiler adds padding for frame alignment, plus 8 bytes of saved RBP. Do not compute it by hand, measure it. - Hint 2: if
x/s $rspat the crash shows something other than the pattern, the program may have crashed somewhere else (for example, too early). Check withinfo registers rip. - Hint 3: get the function address with
info address secret,print secret, ornm crackme_offset | grep secret.
Self-check: is the offset you found equal to 88? If not, can you explain where the difference comes from?
4. Key takeaways
- Install pwndbg or GEF; do not debug pwn challenges with plain gdb.
break <function>,run < file,continue,stepi: the basic rhythm.x/NFU addrto examine memory; remembergis 8 bytes,iis an instruction,sis a string.- Find the offset with cyclic + cyclic_find (or
cyclic -linside pwndbg), never guess. vmmapto see which regions are executable (check NX) and the libc base.got/pltto get entry addresses for GOT overwrite or leaking.
5. Common pitfalls
- Debugging a stripped binary:
break vulnreports no such symbol. Usebreak *0x<address>with an absolute address, taken fromobjdump -dor IDA. - With PIE, addresses change every run under gdb too. gdb disables ASLR by default when running under it, so the address seen in gdb can differ from the address outside it. Do not hardcode a PIE address taken from gdb without accounting for this.
- Misreading cyclic: if the input gets cut by a null byte or a newline (for example a program reading with
scanf("%s")), the pattern does not arrive whole and the computed offset is wrong. Check how the program reads its input. - The environment inside gdb differs from outside: the number of environment variables, and the length of the program name, both shift stack addresses by a few bytes. Use
gdb.attachon a real pwntools process instead of running separately inside gdb when you need an exact stack address. - Forgetting
set follow-fork-mode childwhen the program forks: the breakpoint does not follow into the child process.
6. Further reading
- pwndbg: https://github.com/pwndbg/pwndbg (read the commands section).
- GEF: https://github.com/hugsy/gef.
- The official gdb documentation, chapters on Examining Memory and Breakpoints.
- The gdb/pwndbg command cheatsheet in the repository: resources/cheatsheet.md.